Showing posts with label A3. Show all posts

Wednesday, May 23, 2012

A3-Durkin

  1.            The test bridge used when calculating the Methods of Joints analysis had a span of 24", a height of 6", and a load of 10lbs on the middle joint.

Figure 1: Page One of Sample Bridge Methods of Joints Analysis
Figure 2: Page Two of Sample Bridge Methods of Joints Analysis
2.
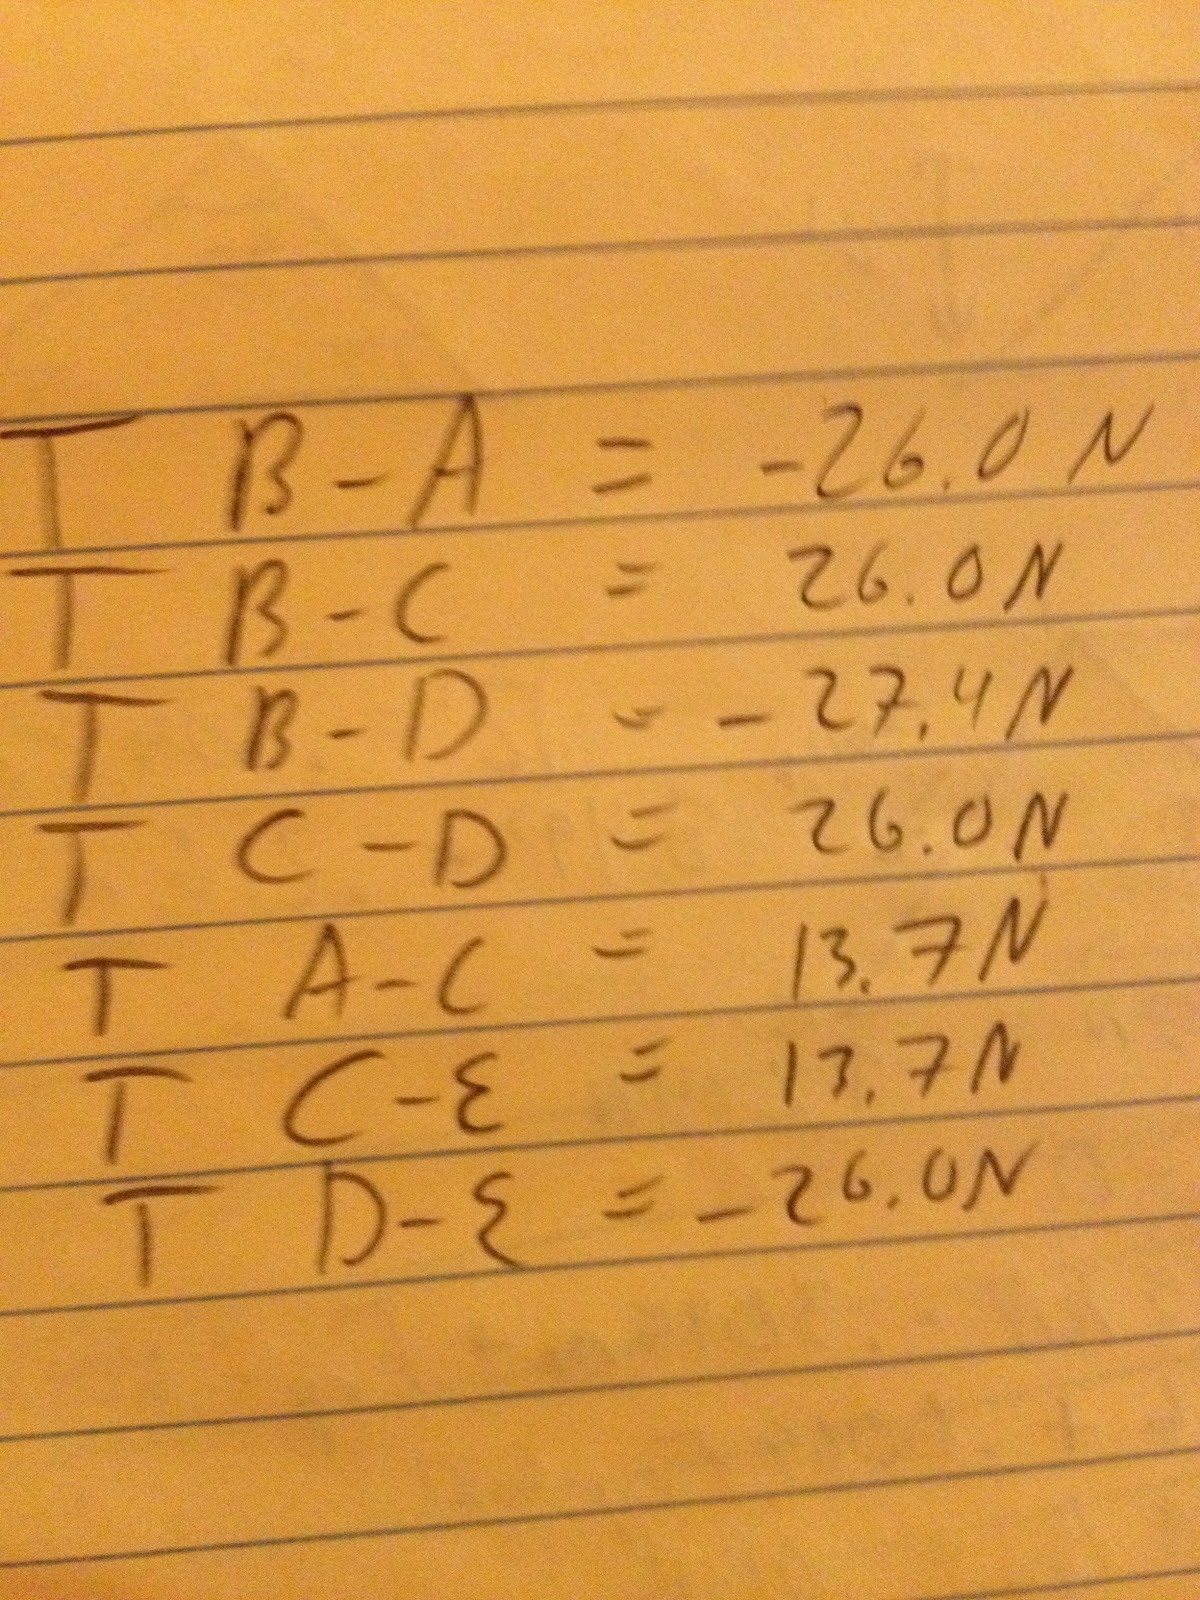
Figure 3: Test Bridge Forces Diagram
Member
Force
TBA 
-26.0N
TBC
26.0N
TBD
-27.4N
TCD
26.0N
TAC
13.7N
TCE
13.7N
TDE
-26.0N

3.
Figure 4: Test Bridge Truss Bridge Designer Analysis
4.         Bridge Designer, a computer program, can calculate nearly the same analysis as shown above in Figures 1 and 2.  This program can scale the length, width, and load of any trust bridge design that is entered into it.  This allows for easier adjustments when doing the analysis.  The problem with scaling the bridge in Bridge Designer is that the outputs Bridge Designer gives then need to be adjust to fit the scaling.  The outputs can be adjusted by multiplying or dividing the numbers by a factor such as two.

5.
Figure 5: Knex Truss Bridge Designer Analysis

           As shown in figure 5 our group scaled down our bridge and built it on the Bridge Designer website.  We found that the greatest force on our bridge according to the website was 90 when 20lbs of weight was applied to the midpoint.  The forces on each member on the outer edge increased as you approach the midpoint.  The cross pieces each seemed to have the same force on them which would mean that the weight was exactly evenly distributed throughout the cross sections which is not very likely. Since none of our members had a force greater than 100 the bridge would hold up if this weight was applied.  According to the Bridge Designer website the bridge would stay standing with a 20lb weight applied but it would not be able to carry much more since the max force of 90 was so close to 100.


6.         The “Testing Information About Knex Joints” gives the average, median, and minimum forces (lb.) that it would take to cause a member to pull out of a joint.  The website does tests with anywhere from one to three member and the necessary forces differ depending on the number of members connected to each joint. The tests show that the greater the number of member connected to each joint the greater the carrying capacity of that joint before the members pull out.  This is a logical result as the greater the number of member the more the weight can be distributed putting less of a strain on one individual piece. This knowledge can be used to improve our bridge because we now know to make sure that there are at least three pieces attached to each joint.

Hudson - A3

Image 1: First page of Method of Joints calculations


Image 2: Second page of Method of Joints calculations
Image 3: Truss Diagram with Forces
Image 4: Table of Tensions with Member to Member Labels 
Image 5: Bridge Designer of Fictitious Truss 
4) Because the Bridge Designer application can't be made to scale, the weights are going to be different than in my analysis. In my analysis I was able to use the exact distances whereas in the Bridge Designer application the distances had to be scaled down to fit in the grid.

Image 6: Bridge Designer of Knex Truss
5.2) The largest force in the Knex truss when you scale off of the Bridge Designer numbers would be approximately 60 which would be found in the middle of the bridge when using 20 pounds of weight. This falls into the expected range of 0-100 before the bridge would break. The forces get larger the closer they get towards the middle of the bridge on the outer edges, but the inner cross-sections have the same tension through-out. While this is possible, it's not entirely plausible which could be the result of the way Knex hold weight.

6) This type of analysis is useful because it allows us to quickly see how what the compression and tension forces are in our bridge so we can modify our bridge accordingly. When you couple this with the information about how knex hold up under different forces you can predict how the knex are going to behave under certain weights and modify the bridge structure to work around these failings.

A3 - Lester

 Figure 1

Figure 2


Figure 3

Figure 4


   I found the tension/compression forces in each member for the sample truss given, as can be seen in the calculations sheet above (Figure 1). The forces were calculated using the “Method of Joints”. Following the video instructions, a free body diagram was made for each joint. The X and Y components are separated and, since there was no movement and therefore no acceleration in the system, the sum of the forces equals zero. Apart from the tension/compression forces, there is a force in the X-direction resulting from the fixed node, and a normal force in the Y-direction from the upward resulting force on the table. Some forces were equal to each other, as shown in the calculations. A drawing from the calculations sheet is enlarged in Figure 2. This drawing labels each member with the corresponding force.
   The drawing and analysis was replicated in the Bridge Designer program. The dimensions given were h=8”, L=24”, and W (weight applied)=15 pounds. However, the Bridge Designer field was not big enough for those dimensions. The measurements were scaled down by a factor of two, for a new h=4” and L=24”.  After initializing a load test, it was shown that the tension/compression forces found in the calculations page were very close (rounded to the nearest whole number) to the calculations I found by hand. This analysis can be seen in Figure 3.
   Finally, our group modeled our Knex Truss on the Bridge Designer program (Figure 4) and applied a load of 20 pounds to the midpoint. The dimensions were scaled down using the same method as Figure 3. The corresponding calculations for tension/compression were in the expected range, and not above 100, which would mean the Truss would break with the applied load. The forces increase in magnitude the closer they are to the midpoint and the applied load. However, none of the forces were above 100, so the truss is effective. This information can be used to fine-tune our design. Now that we know the center has the most force, we can add extra support, increase the members, or even slightly change the design to maximize the load it can carry. We will do this between the Week 8 and Week 9 labs, before writing the lab report that summarizes our final design and other aspects of the project. 
   This tests were very helpful in discovering how forces are distributed in a truss system. Knowing which members will have tension and which will have compression is helpful in deciding which members or joints to reinforce. Also, it can be seen that the center of the truss bears the most load. We must make sure that the center of our Knex bridge is strong enough to support that load.